Getting started with DirectQuery
Early adopter
The features described in this section are currently in Beta and are only available to customers via our Early Adopter program. For more information and to sign up, visit the Early Adopter Group on the Cognite Hub.
This article explains how you can use DirectQuery in Power BI to query CDF for data every time you interact with a dashboard instead of importing or copying data into Power BI Desktop.
Import time series
To query aggregated data points in DirectQuery mode, you first need to import time series using the Power BI PostgreSQL connector.
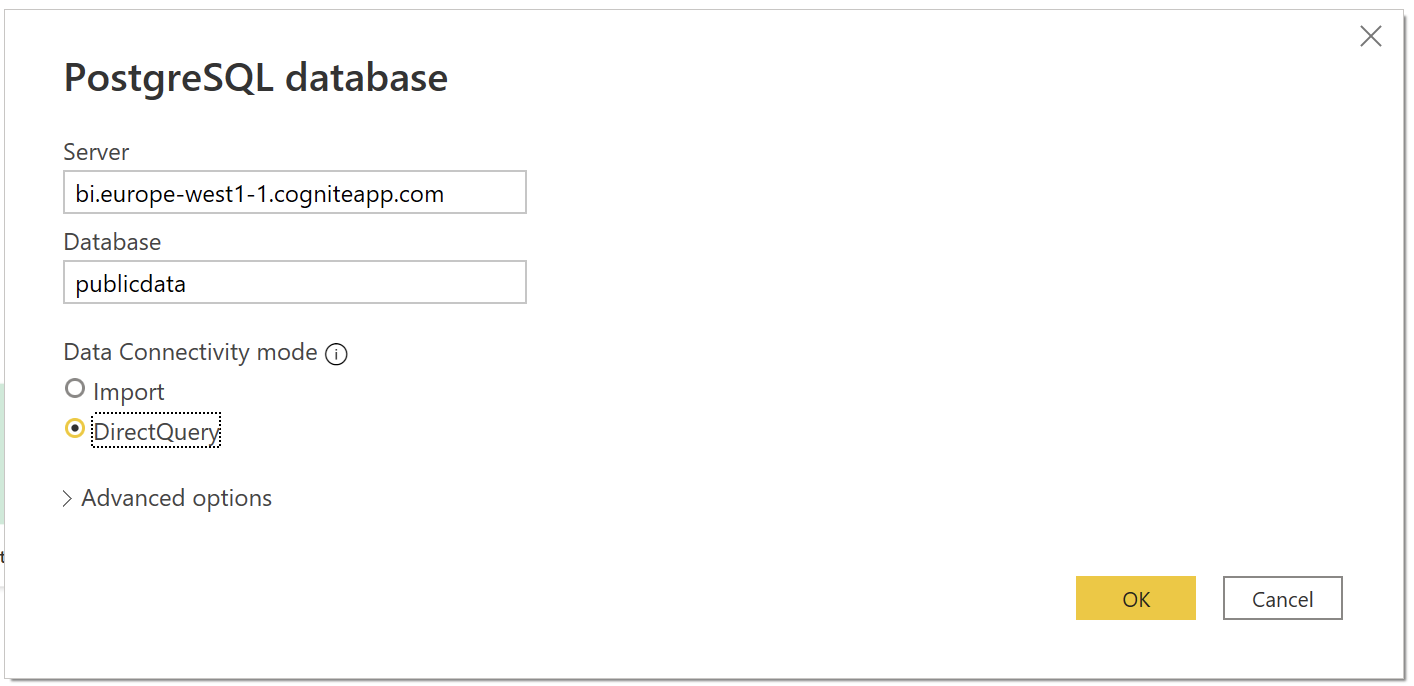
In Power BI desktop, select Get data > Database > PostgreSQL database.
Specify the PostgreSQL database:
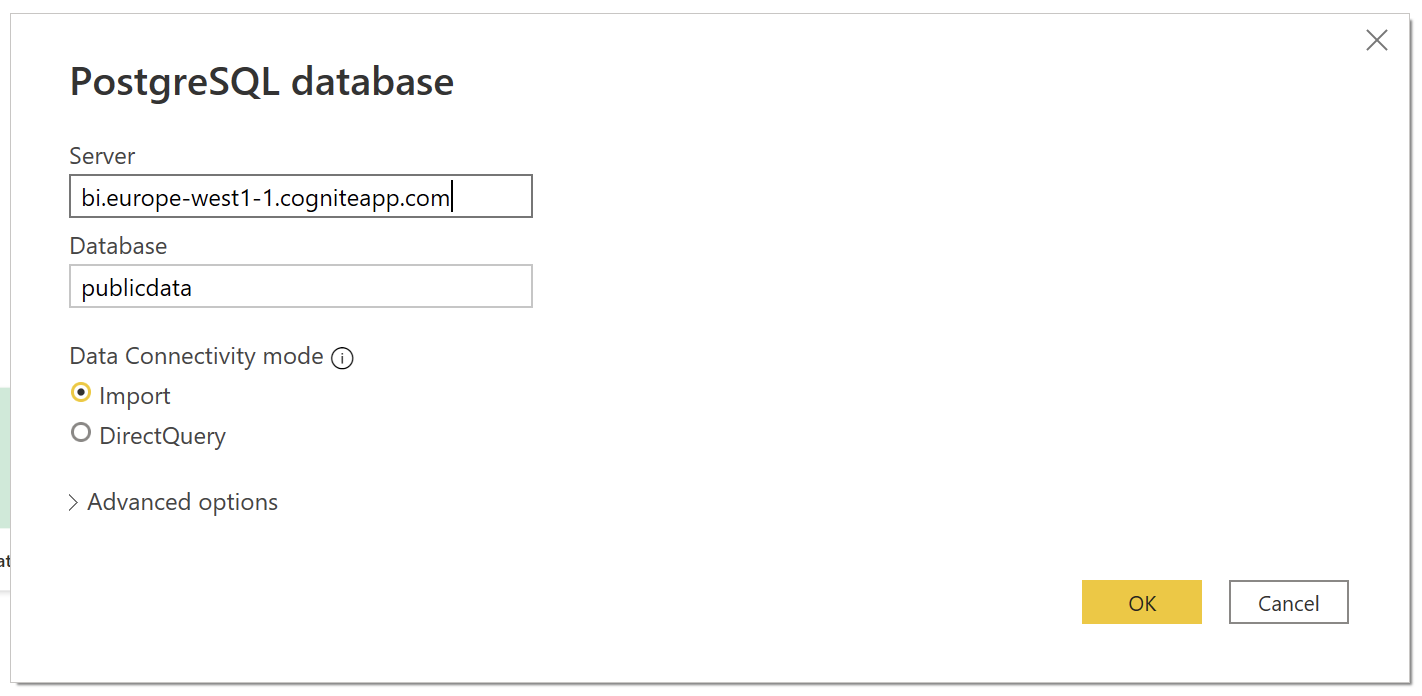
- Server: bi.{cluster}.cogniteapp.com (For example,
bi.europe-west1-1.cogniteapp.com) - Database: the CDF project name in the cluster.
- Data Connectivity mode: Import.
- Server: bi.{cluster}.cogniteapp.com (For example,
Enter your credentials to authenticate.
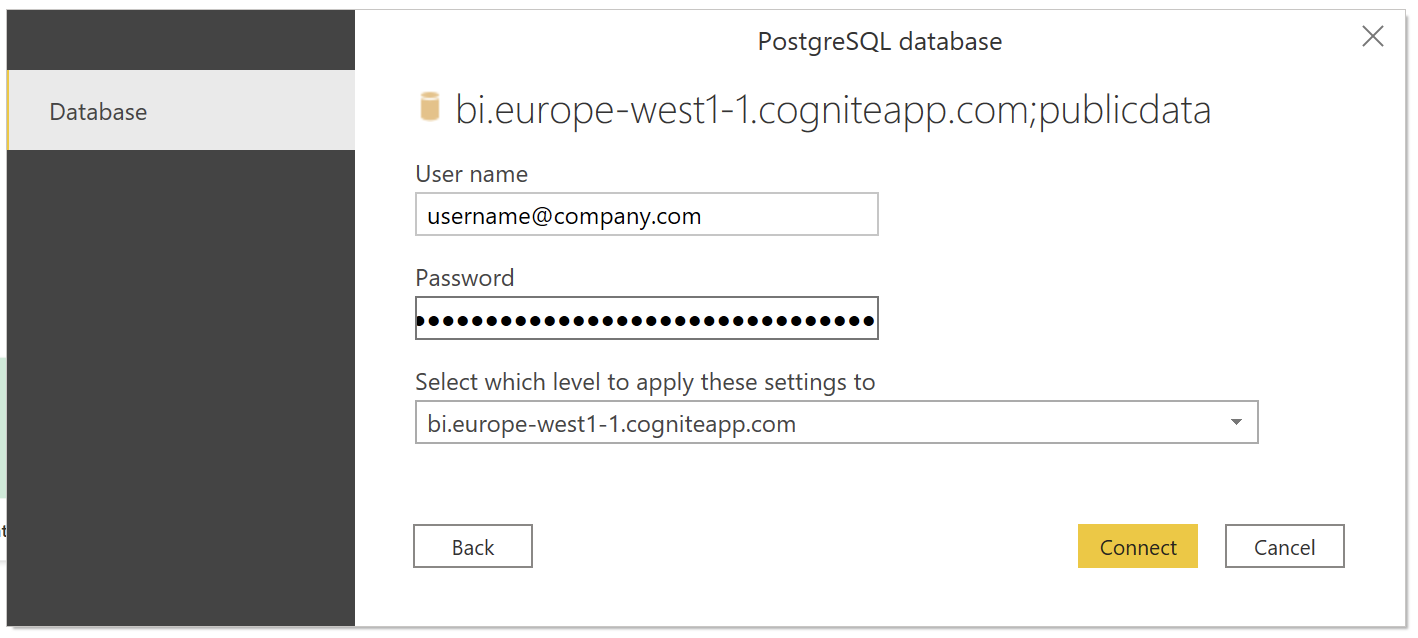
Username: email address, i.e user@cognitedata.com
Password: <dashboard token>
To enable dashboard sessions for the project:
Make sure sessions are allowed for your account (capabilities:
sessions:list,sessions:create).In CDF, navigate to Manage > Manage access > Open ID connect and make sure the token URL is correct.
The token URL should have this format: https://login.microsoftonline.com/{tenant-id}/oauth2/v2.0/token
To generate a new dashboard token:
- Navigate to Manage > Dashboard sessions > New session
- Copy the session token and use it as a password when authenticating with the Power BI PostgreSQL data source.
Legacy API key authentication
- Username: email address, i.e user@cognitedata.com
- Password: API key
Select the time series table you want to import.
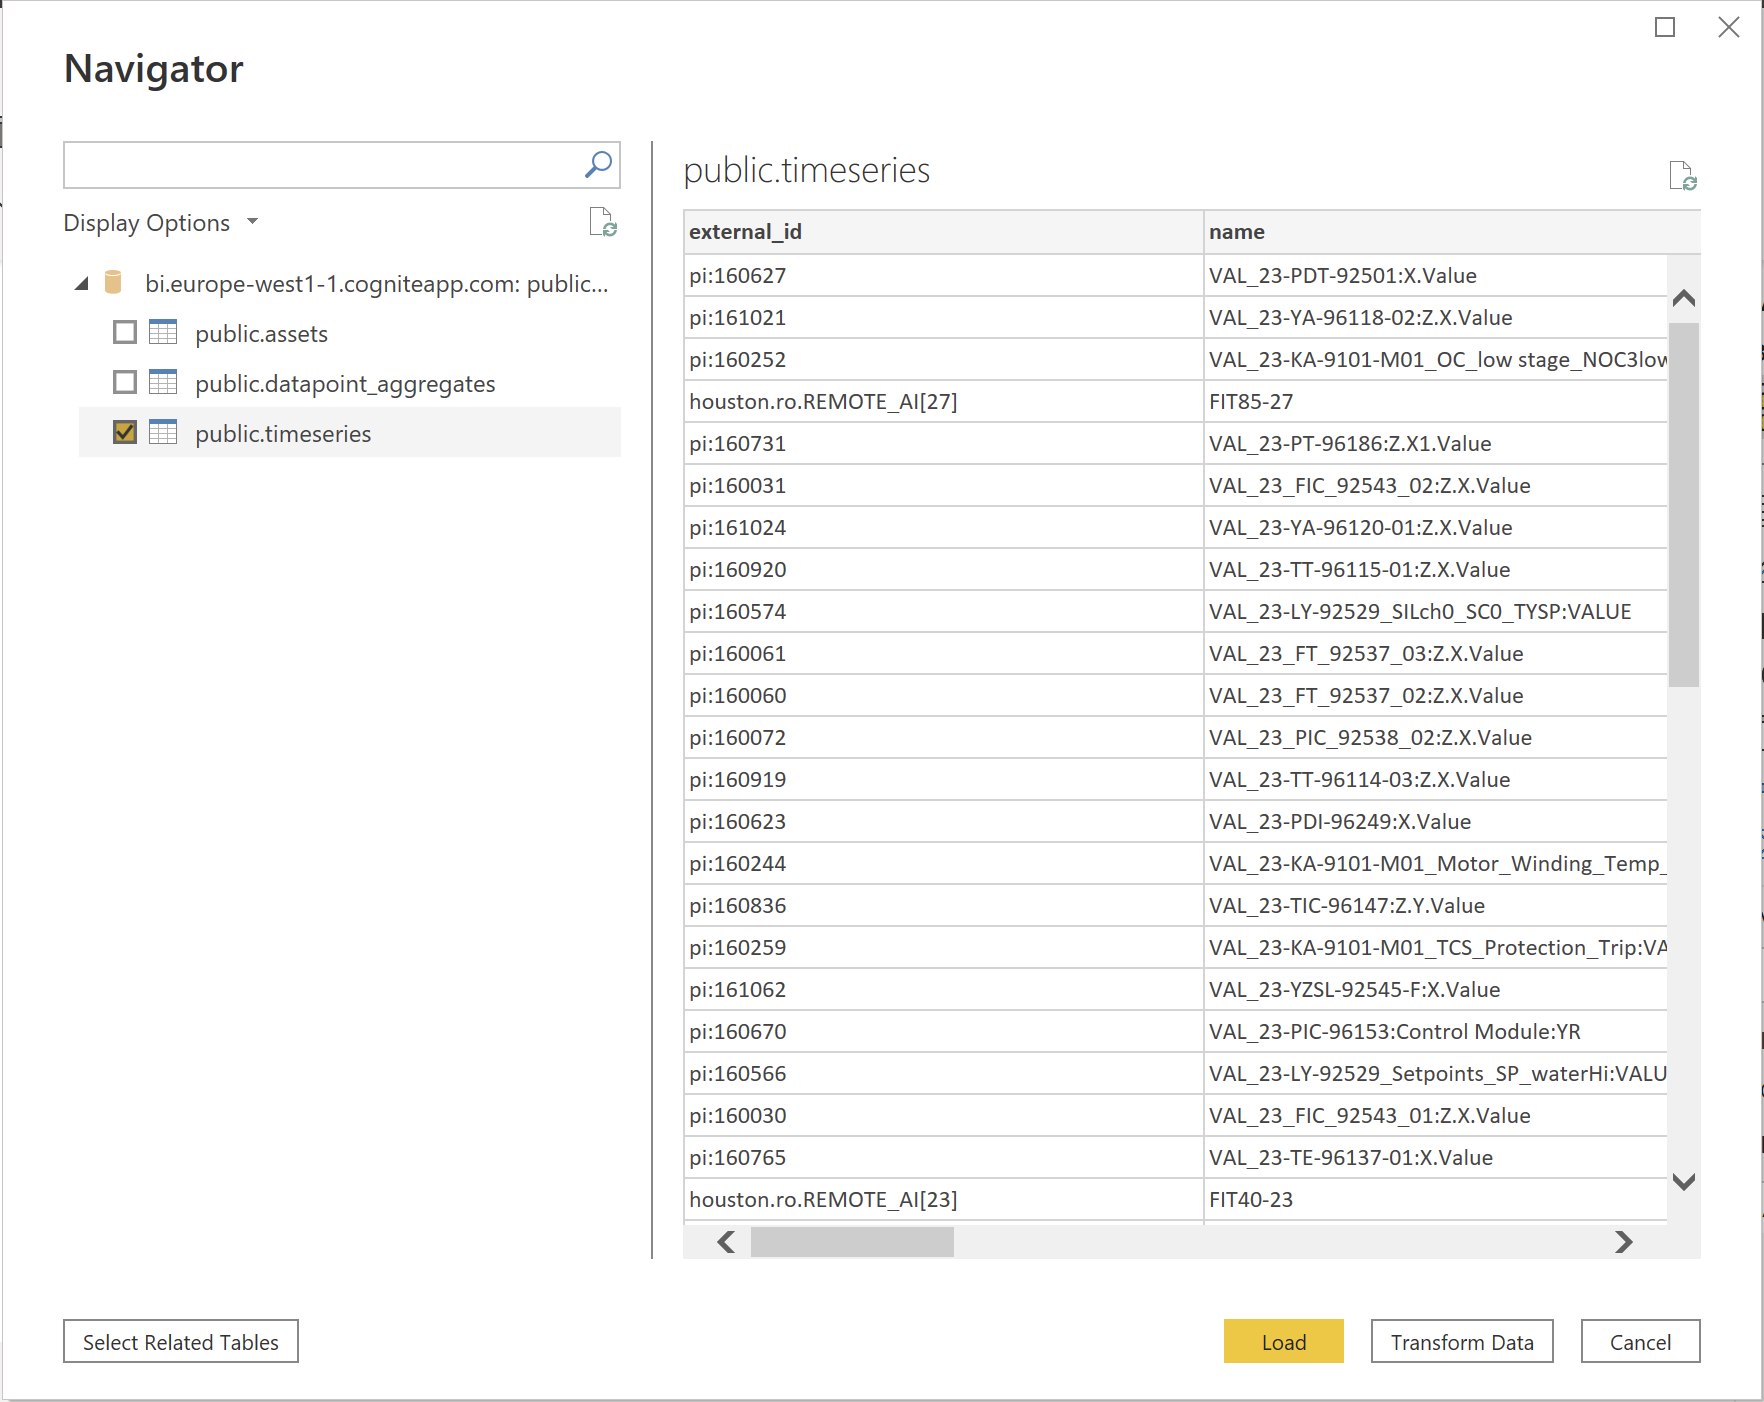
Use a filter to select a subset of the time series to limit the load.
Connect to DirectQuery
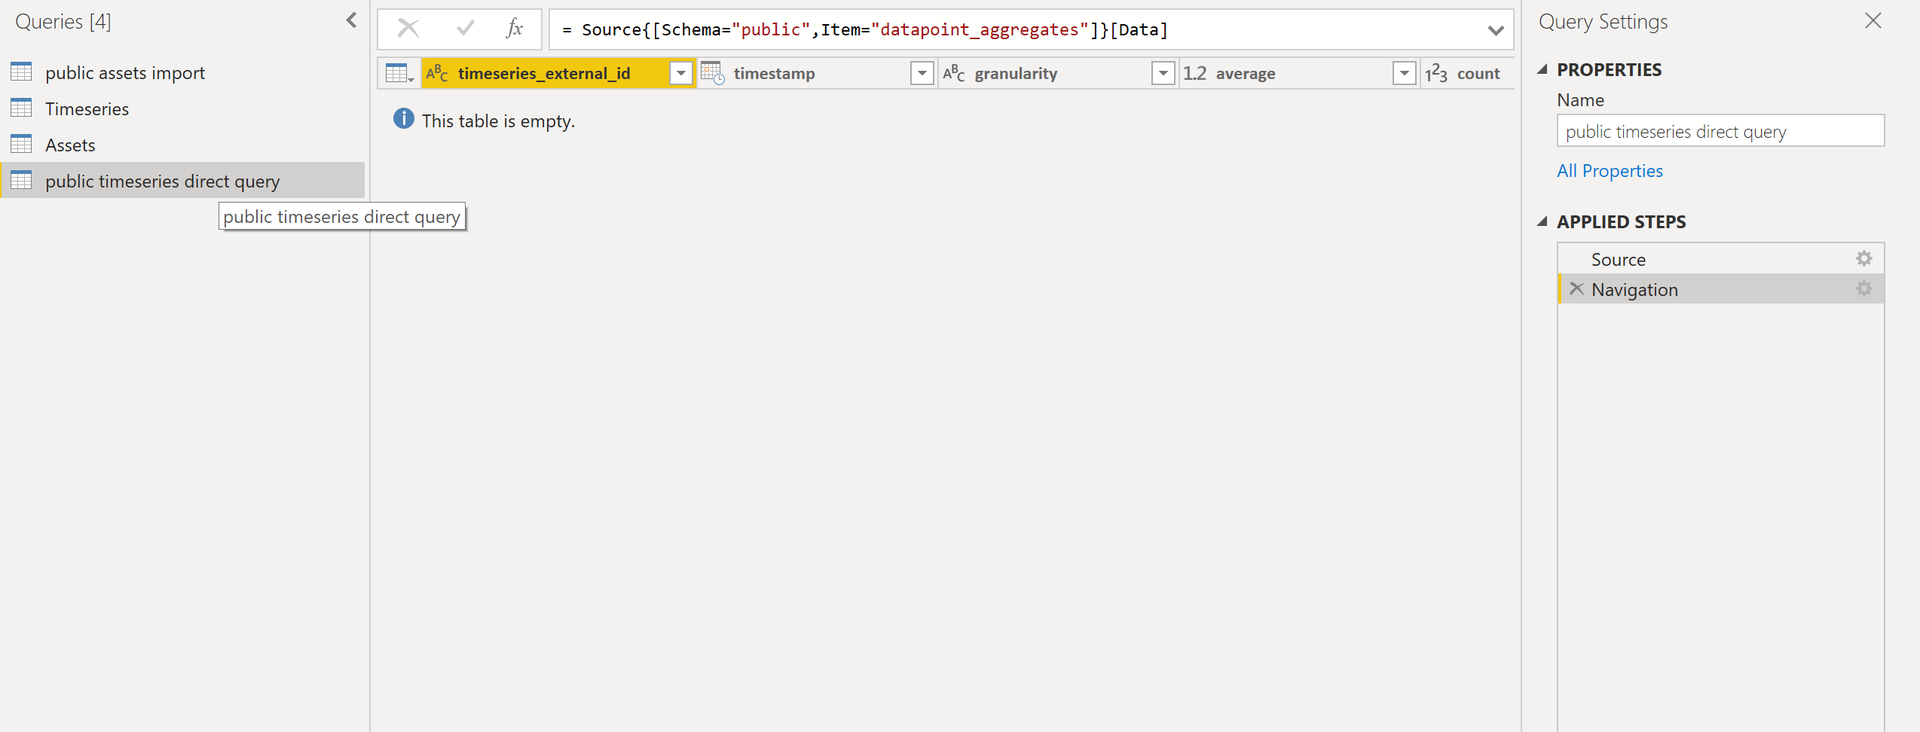
Select Get data > Database > PostgreSQL database to add a DirectQuery data points table.
- Data Connectivity mode: DirectQuery
- Credentials: see step 3 above.
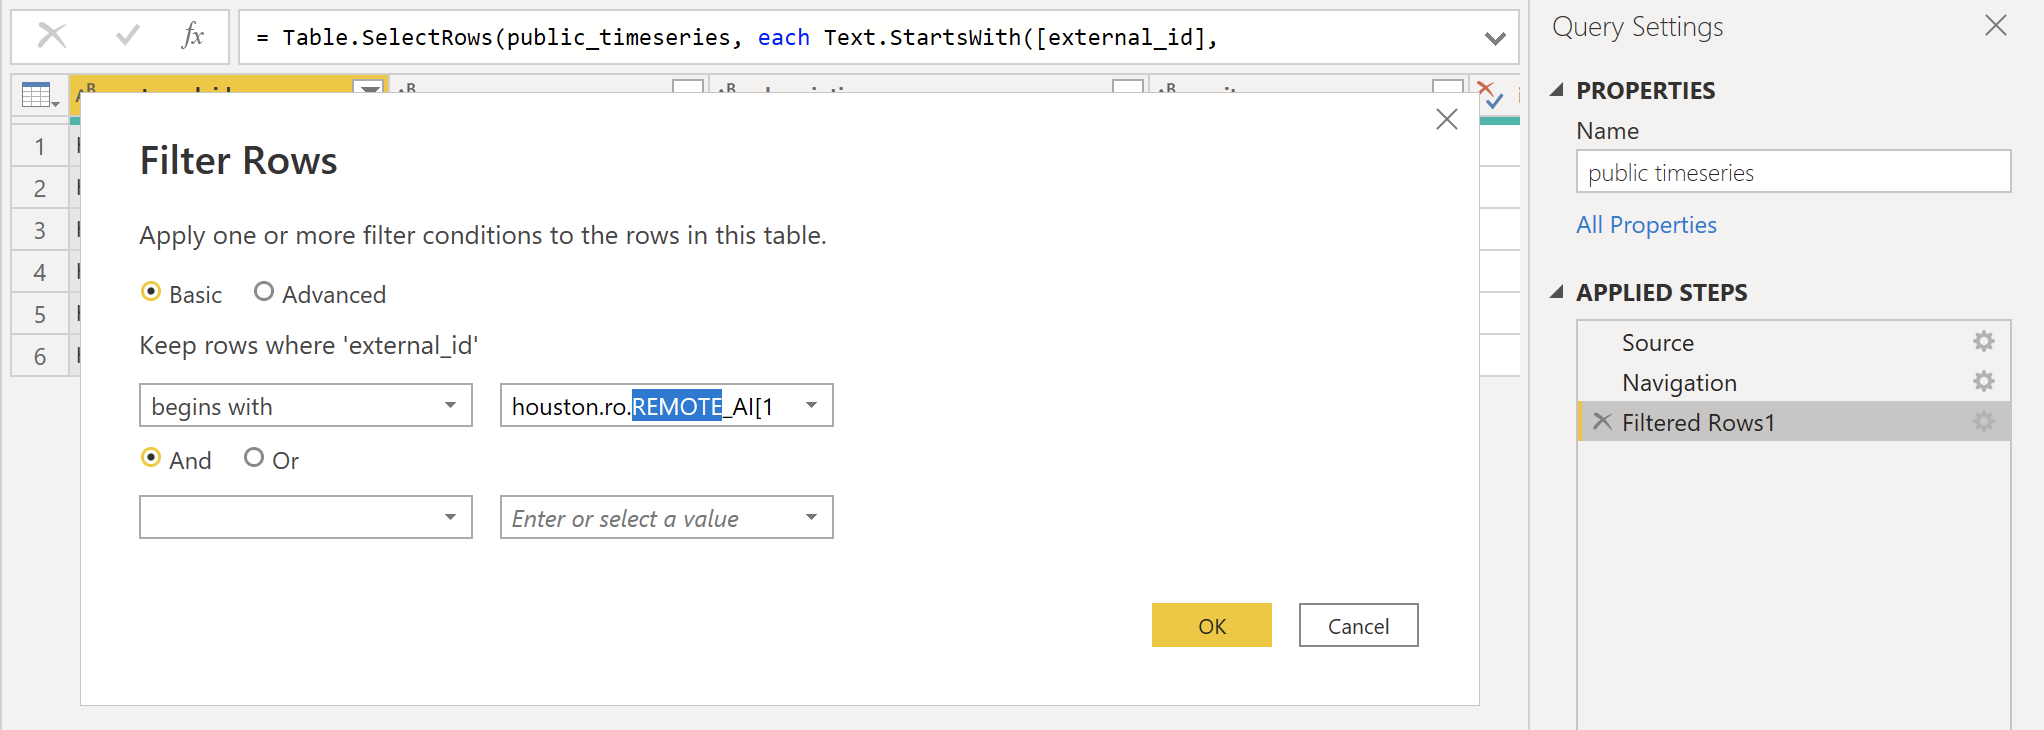
Data points aggregates return an empty result by default.
To populate the table with data, you need to apply at least an
external_idfilter to it.This example uses DirectQuery, which doesn't require predefined filters. Instead, we apply filters using Power BI relationships and DirectQuery.
Select Close & Apply to close the query editor and start building visualizations.
Build visualizations
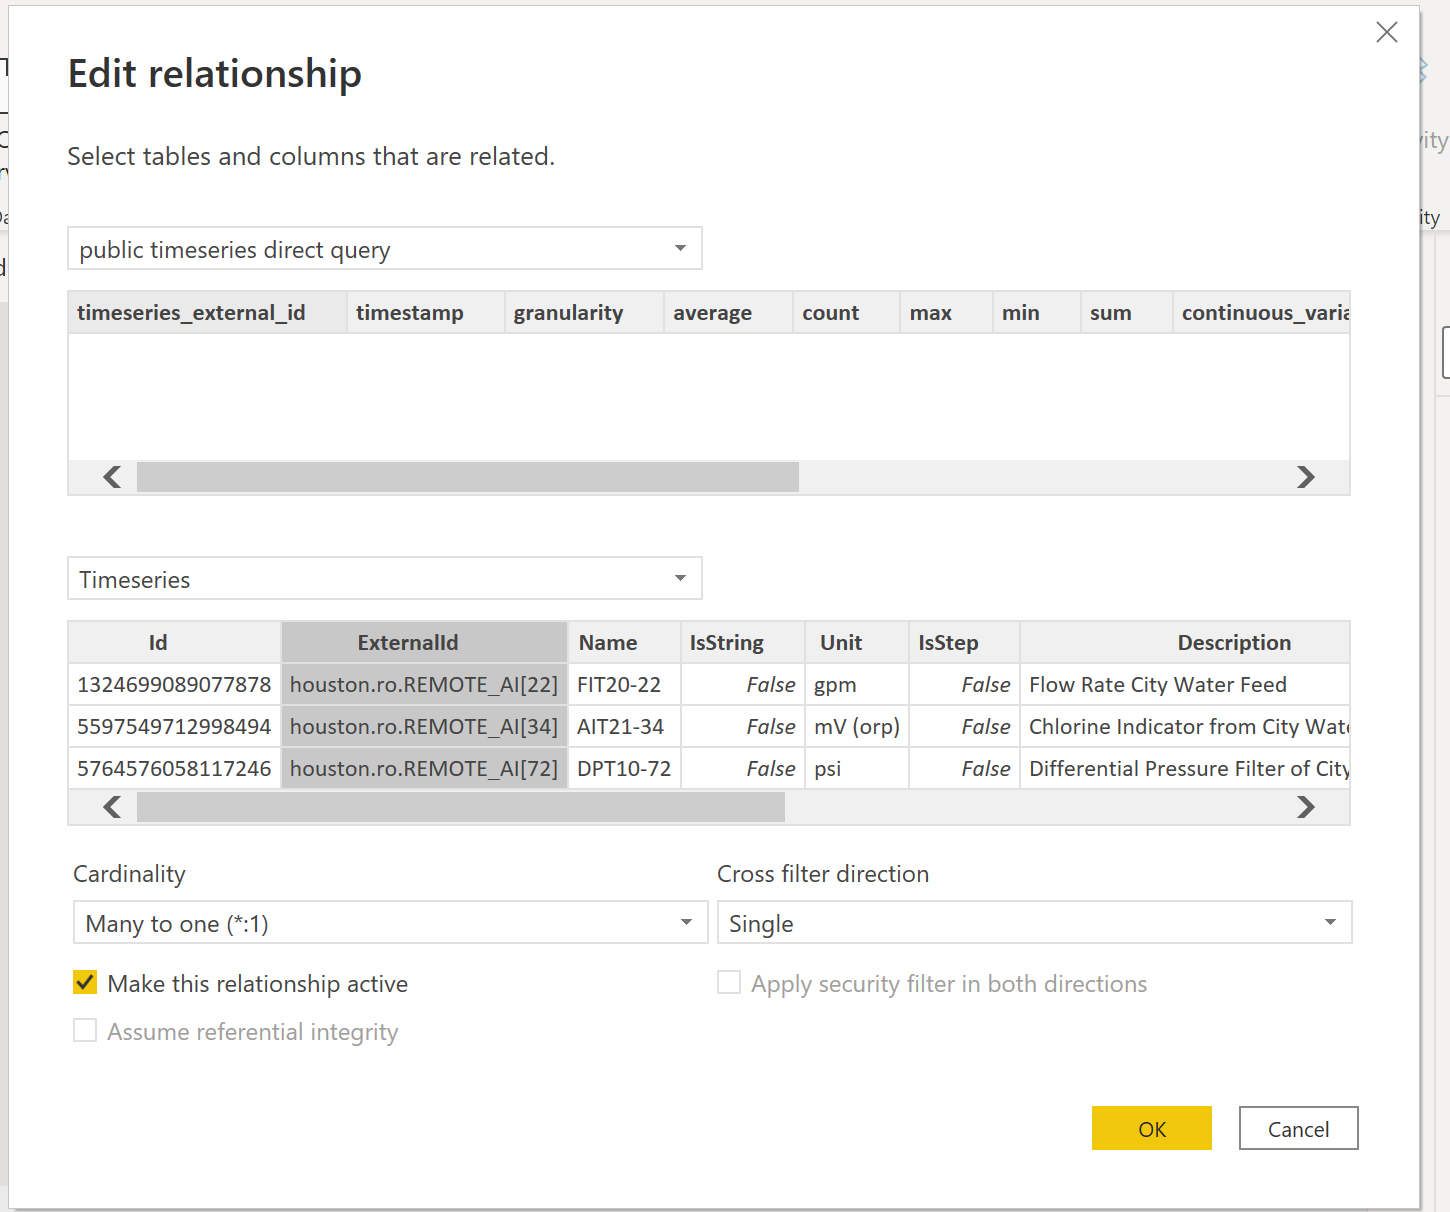
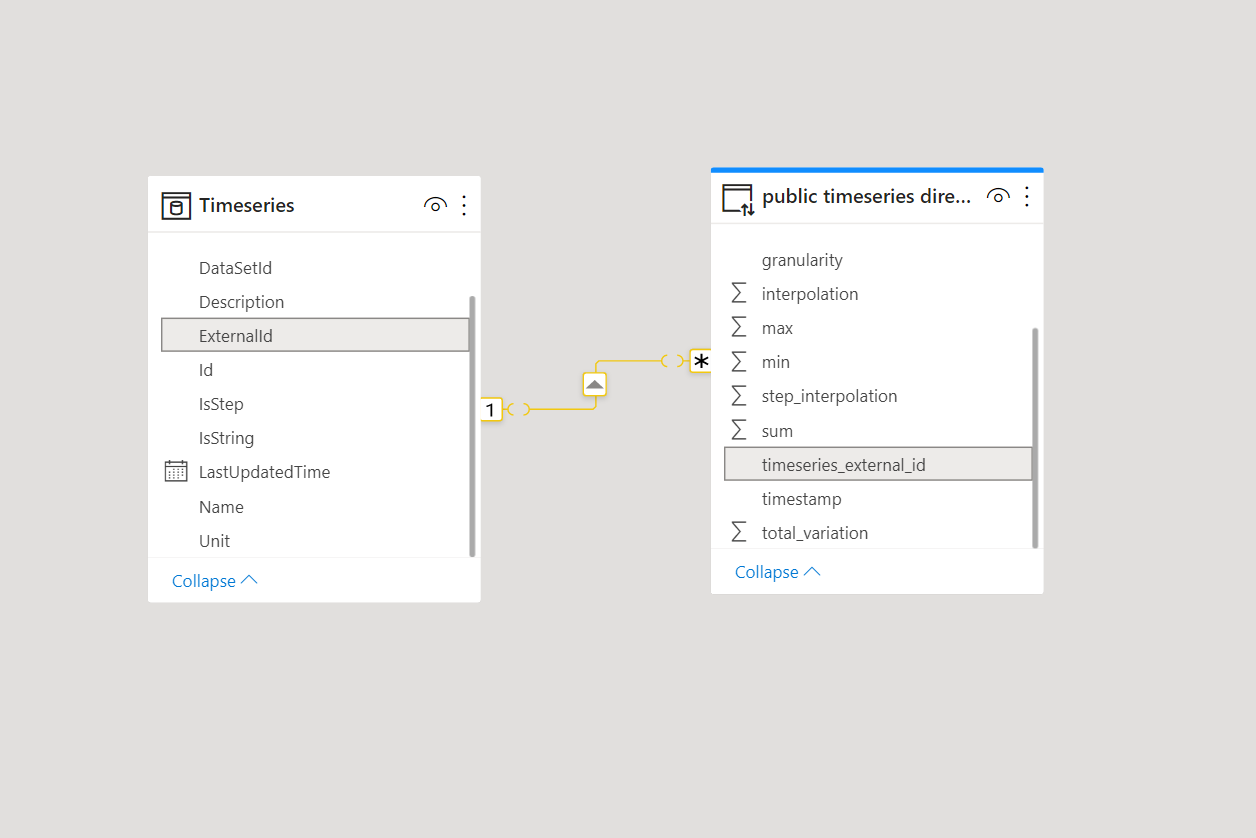
Use the data modeler to connect the imported tables with DirectQuery.
Create a one-to-many relationship between
timeseries.external_id(imported) anddatapoint_aggregates.timeseries_external_id(DirectQuery).Select Cross filter direction: Single
Use slicers to filter what to visualize and the time frame you want to see.
Select Slicer from Visualizations, and add a timestamp column from the DirectQuery table.
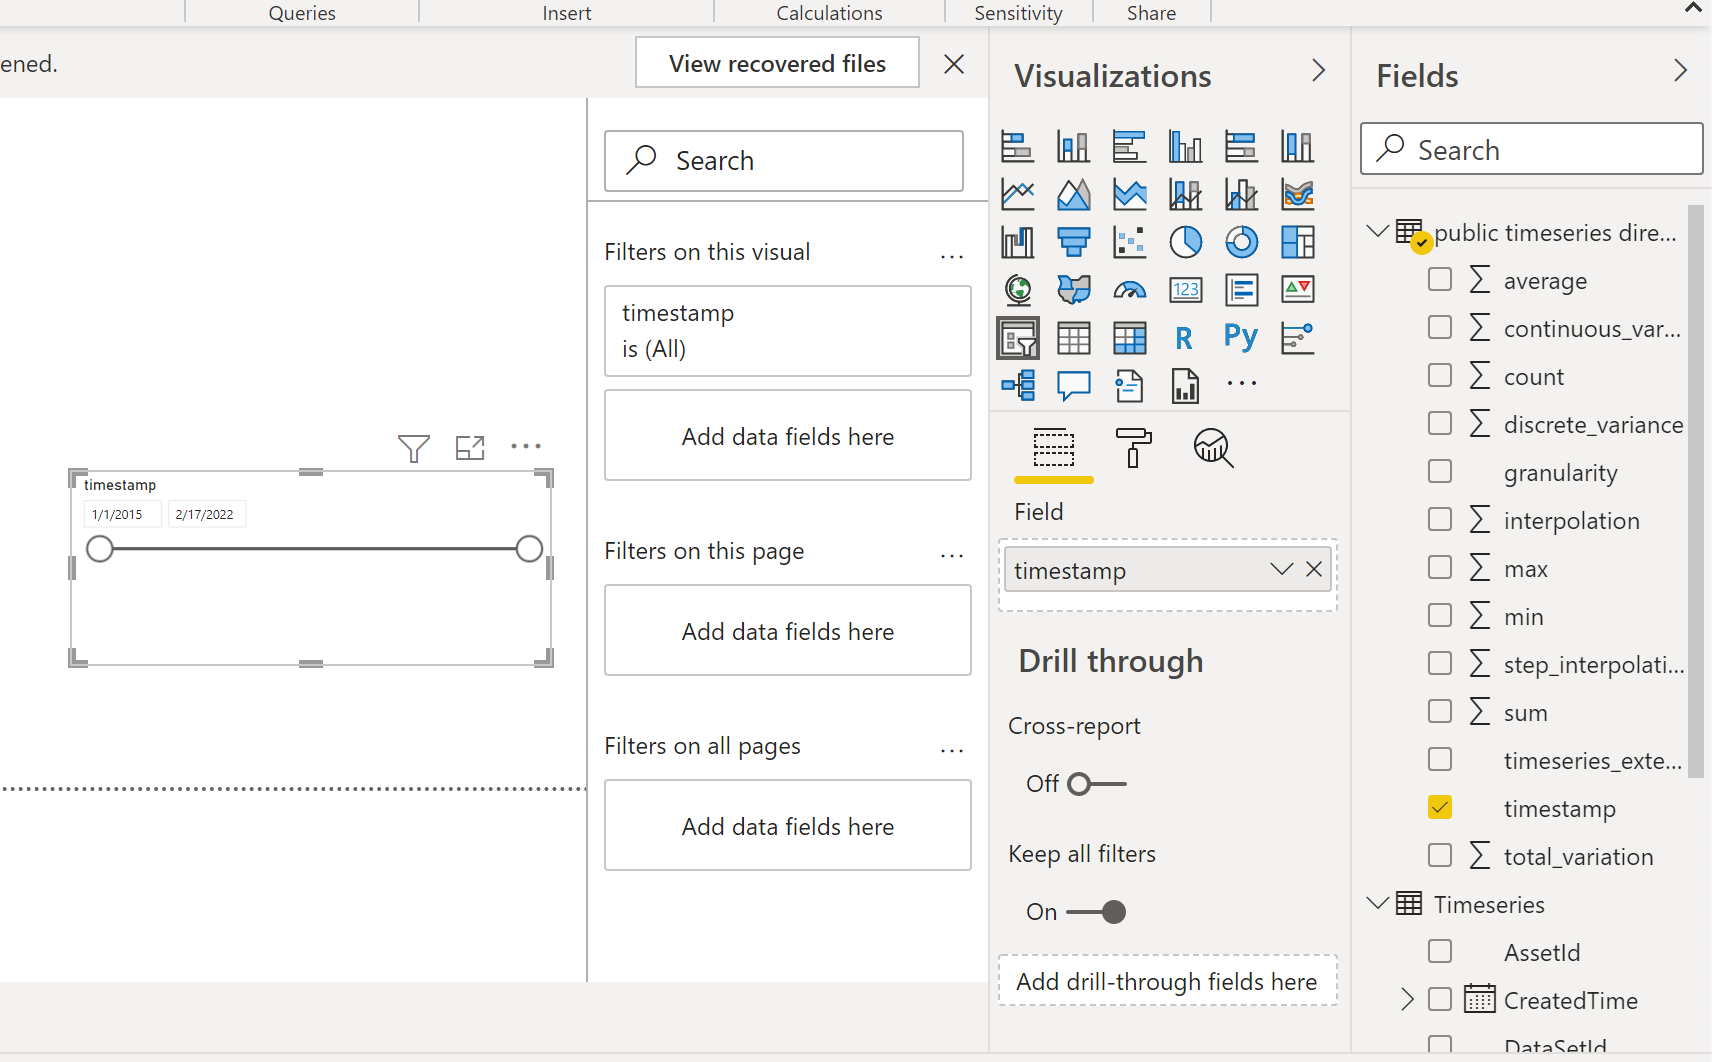
Add another slicer and add the time series name column to it.
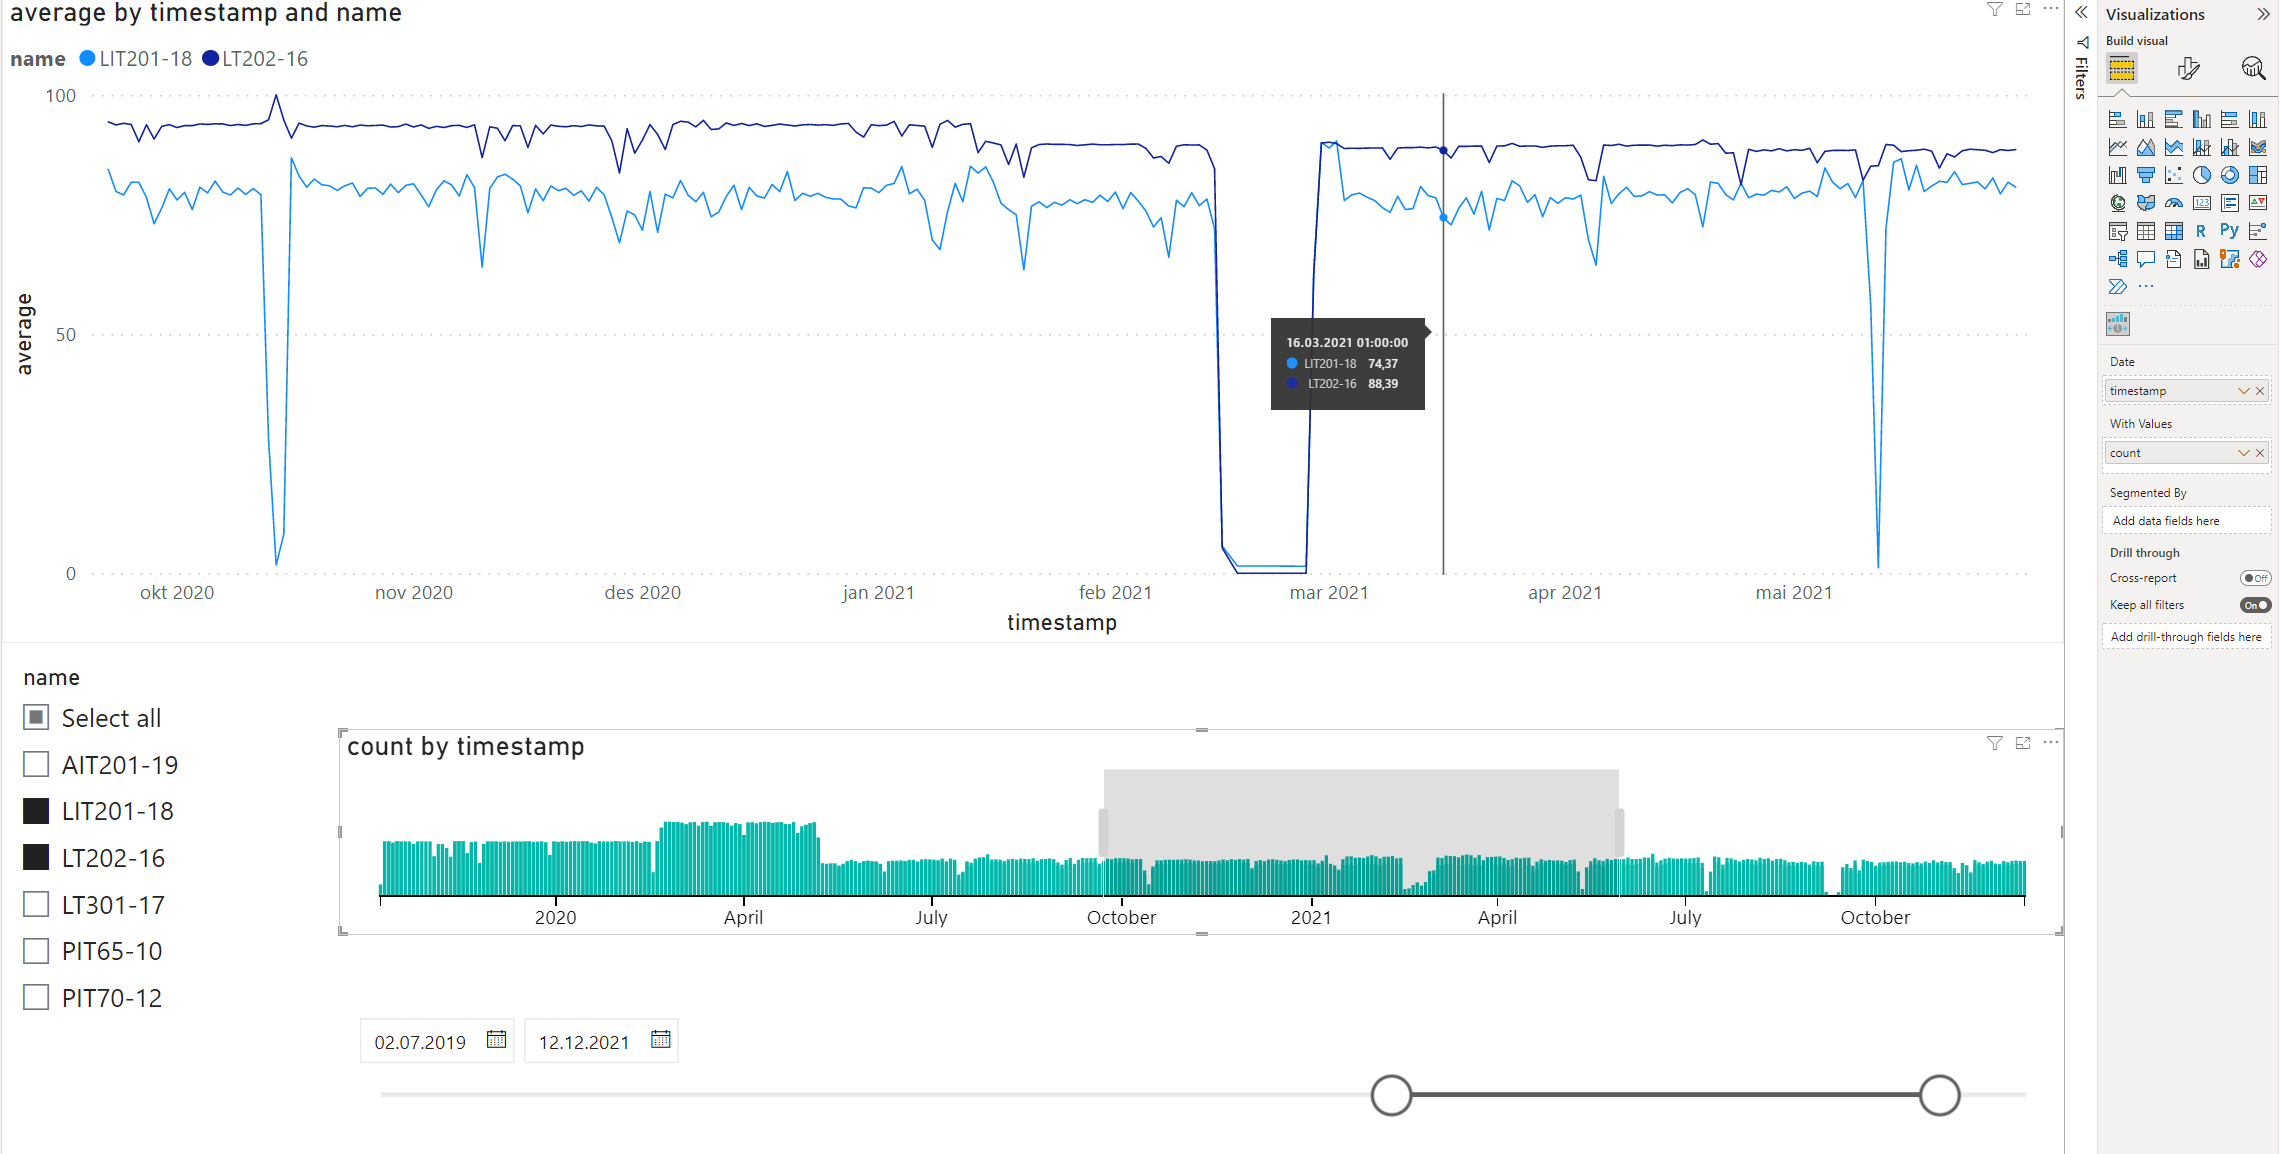
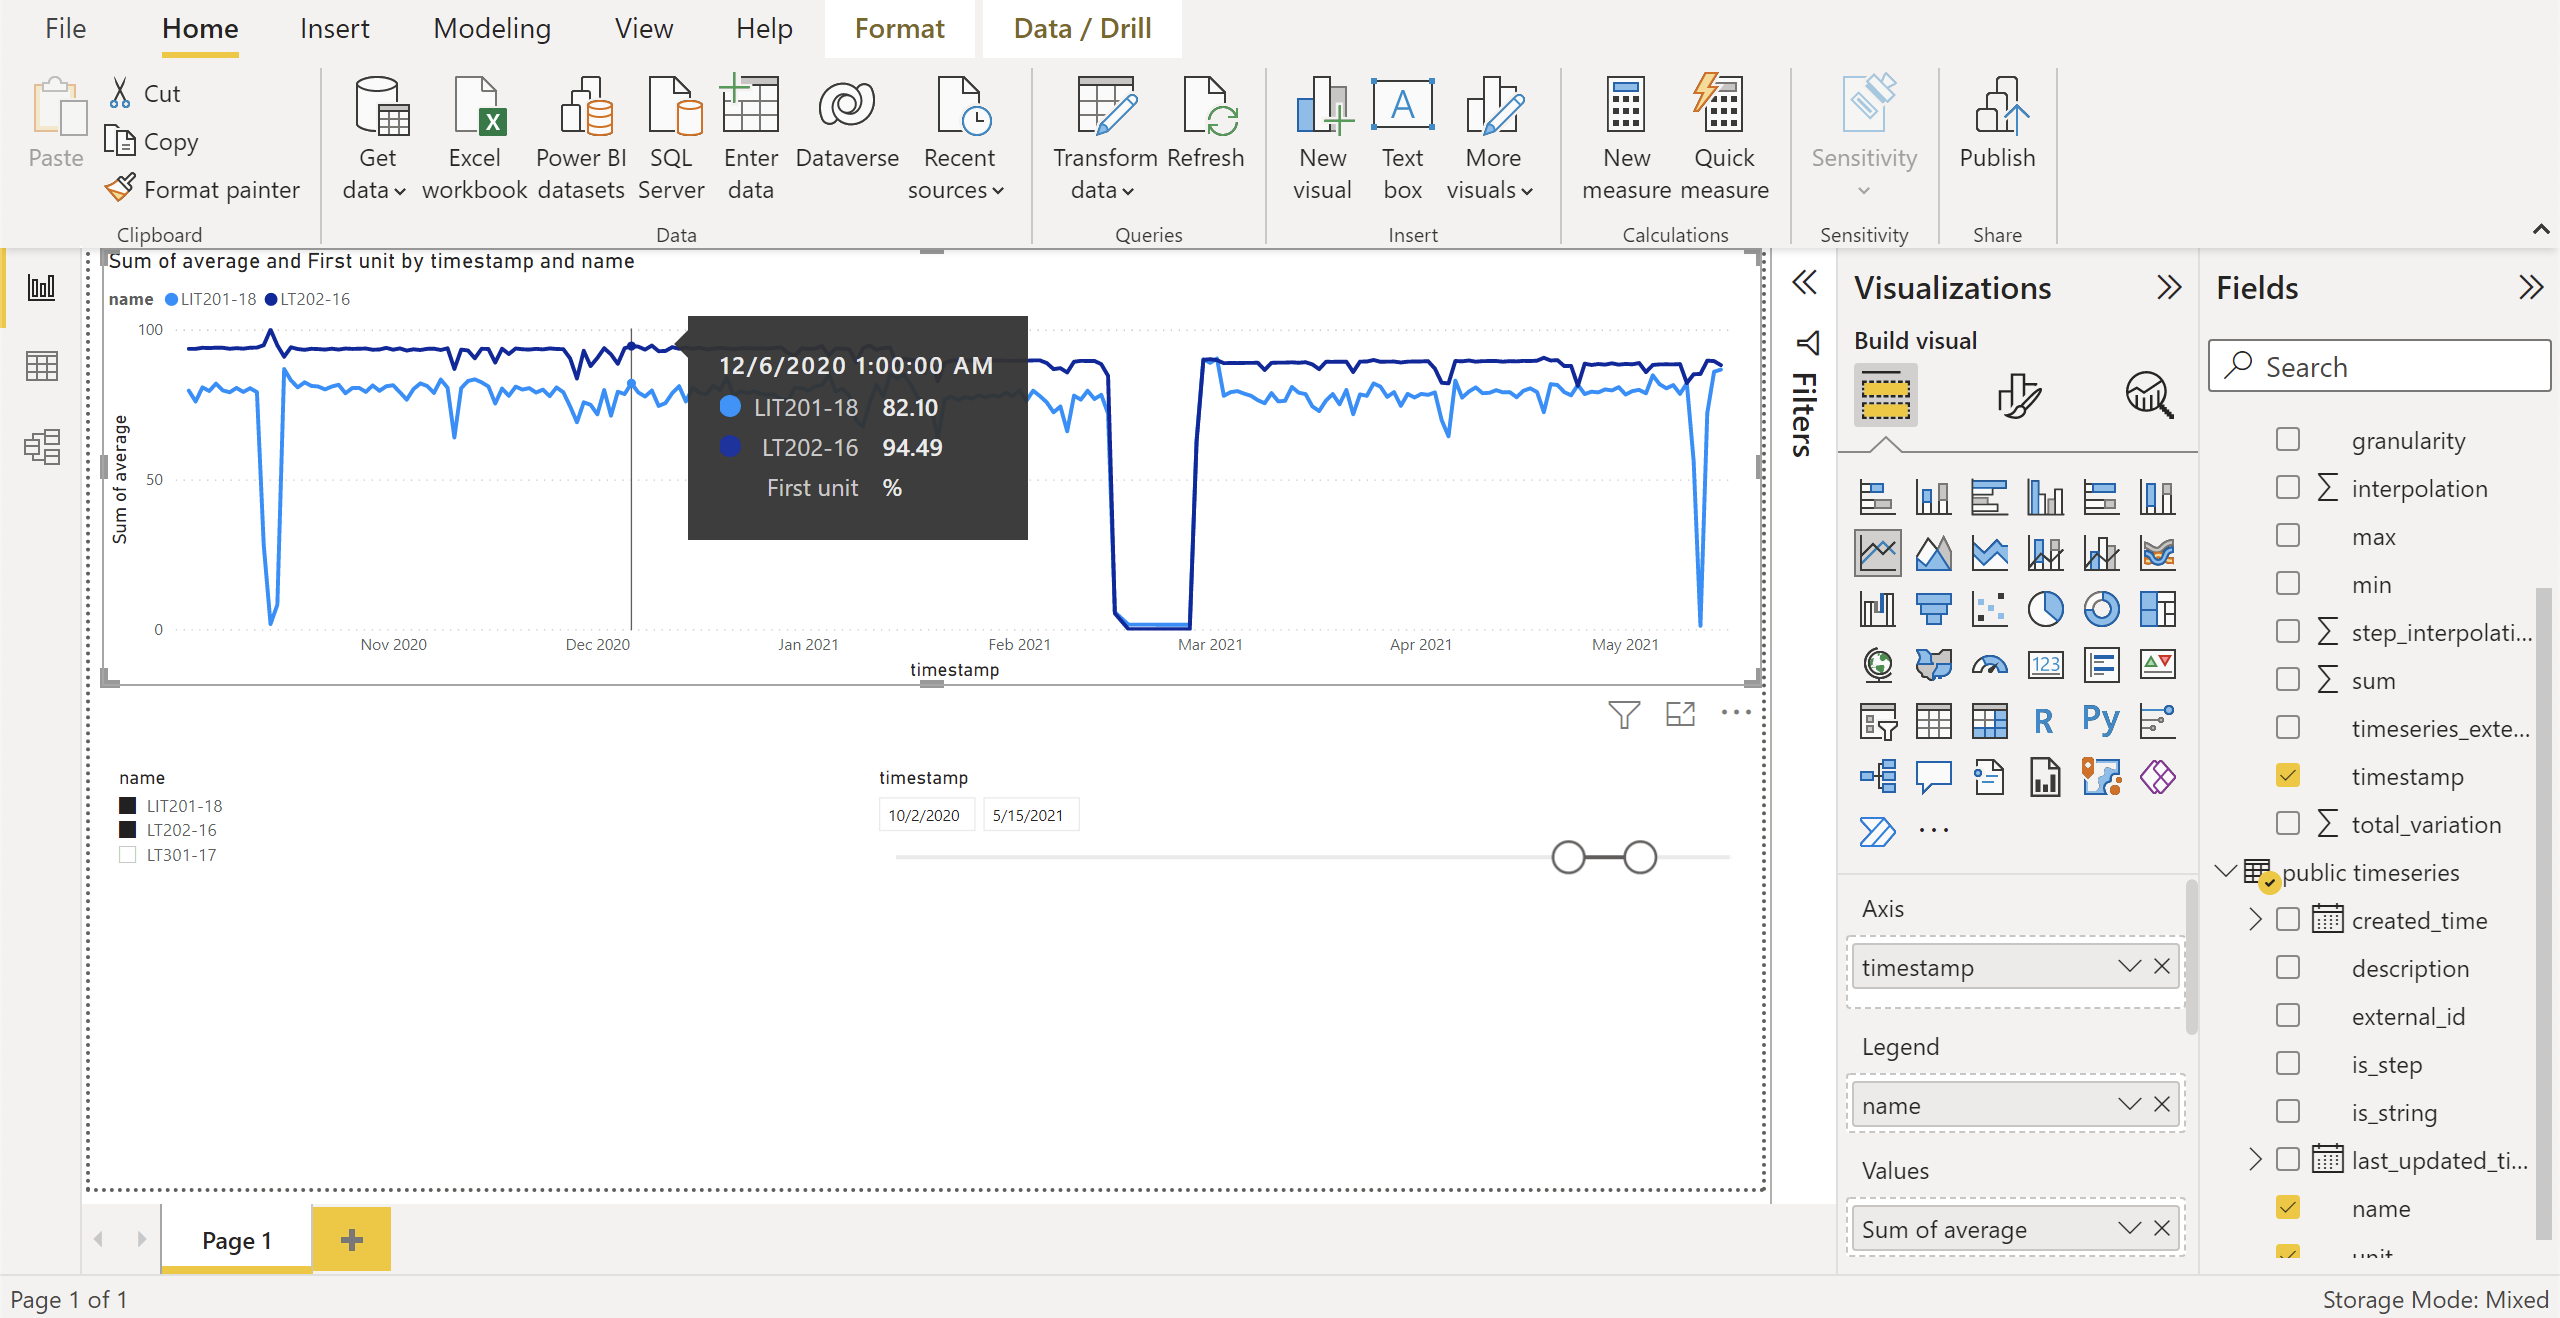
Add a line chart:
Values: datapoint_aggregates.average (DirectQuery)
Legend: timeseries.name (imported)
Axis: datapoint_aggregates.timestamp (DirectQuery)
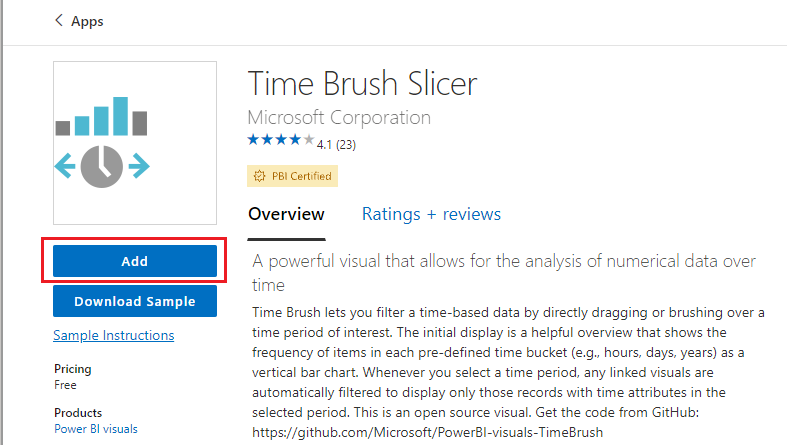
The default time slicer in Power BI can only slice down to days, not hours. Combining the default time slicer with the Microsoft Time Brush Slicer enables a more fine-grained time slicing.
Navigate to the Power BI visual marketplace:
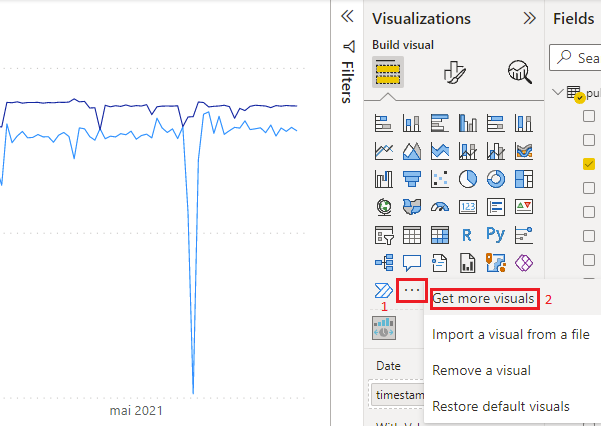
Search for Time Brush Slicer, and Add it.
Add the time brush slicer to your dashboard. To enable slicing, you must populate the slicer with Timestamp and Count from datapoint aggregates.